
Contact
We think you might be interested in Bilfinger %s website.
Otherwise select the country you are interested in here.
+

Environment

Climate neutral in GHG Scope 1 & 2
until 2030 at the latest

In its sixth report, Climate Change 2022, the Intergovernmental Panel on Climate Change examined the effects of climate change and presented the impact of the man-made share. Global temperatures are expected to rise by 2 degrees Celsius. This poses a threat to the ecosystems of our planet, endangers the health of humans, animals and plants, and can mean that the world’s growing population cannot be adequately supplied with food. Bilfinger therefore attaches particular importance to climate protection.

With our Mission Statement and our Code of Conduct, we clearly commit to responsibility for society and the environment. We consume considerably less energy than manufacturing companies, but we have nevertheless set ourselves the task of making a contribution to a reduction in greenhouse gases.

Our Concept

In the Bilfinger Group, energy consumption data is collected at the level of the operating units. 36 Group companies with 143 locations are certified in accordance with the international environmental management standard DIN EN ISO 14001. That is how operational units have been meeting the requirements of their regional and local customers for many years.

We use a software-based, structured recording process to monitor energy consumption and calculate the associated greenhouse gas emissions. Internal reporting of energy consumption and emissions follows the method laid out in the Greenhouse Gas Protocol (GHG Protocol). The energy consumption recorded here includes all fully consolidated properties in the Group with the exception of one unit in South Africa. Plans call for this unit to be sold and it is therefore allocated to the Other Operations segment. This segment accounted for 3.7 percent of Group revenue in the reporting year.

We disclose our climate-related activities through our participation in CDP.

Energy

Energy

The majority of our energy requirements comes from our vehicle fleet and our properties. For the transport of work materials, including scaffolding, we use a fleet of commercial vehicles over 3.5 tons with most of these running on diesel fuel. More than half of the energy consumed by Bilfinger thus comes from fuel consumption from petrochemical products.

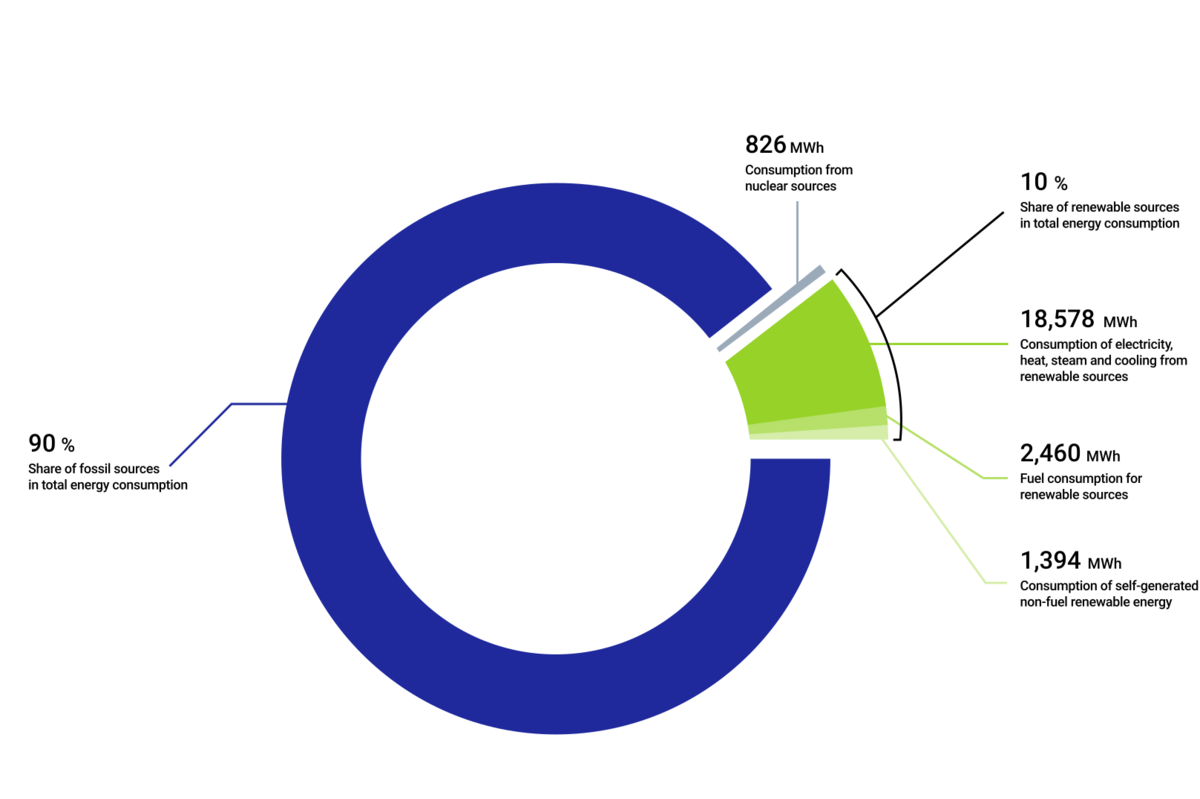
The Group’s total energy consumption fell in financial year 2023 by 9 percent to 200,031 MWh (previous year: 220,838 MWh).

Learn more

The properties that are included in the analysis comprise Bilfinger’s owner-occupied properties as well as properties used under long-term leases. We use energy from both renewable energy sources and non-renewable energy sources in the properties, including electricity, heating and cooling.

The consumption from other energy sources is determined for each source in a standardized base unit. The factors published by the UK Department for the Environment, Food & Rural Affairs (DEFRA) are used to calculate the heating value.

The energy is calculated using the following formula: Indicators (base unit) x heating value (kWh/base unit) = energy (kWh)

In the case of non-calendar accounting on the part of utilities – for example if the annual statement was not yet available – data for 2023 were completed on the basis of the figures for the previous year. Alternatively, the last quarter was determined on the basis of previous quarters, for example in the area of heating energy from the first quarter due to similar weather conditions or from the third quarter for other consumption values. In the case of flat-rate rents, the Group’s average consumption figure per square meter was used for the calculation.

The change can largely be explained by the calculation method specified in anticipation of the CSRD reporting. While the calculation of the base unit to energy value in 2022 was carried out on the basis of the respective upper heating value, the CSRD provides for the use of the lower heating value. While the lower heating value represents only the energy that can be used as heat through combustion, the upper heating value also includes the heat generated from the combustion exhaust gases. This means that the lower heating value is below the upper heating value and varies depending on the energy source. This change has no impact on the factors that are already measured in MWh in the base unit, as is the case with electricity or district heating, for example.

The comparative application of the lower heating value to calculate the total energy consumption for the values of the 2022 financial year is 211,982 MWh. The reduction in total energy consumption on a comparable basis is therefore 6 percent. The effects of our efficiency efforts are visible in the consumption of purchased or received electricity, heat, industrial process waste heat, steam and cooling.

In the fossil energy part, consumption fell by 15 percent to 48,785 MWh (previous year: 57,453 MWh). In the area of renewable energies, consumption was up 10 percent to 17,349 MWh (previous year: 15,765 MWh). In addition, the consumption of self-generated renewable energy increased to 773 MWh (previous year: 166 MWh).

Energy consumption and share by energy source

ENERGY CONSUMPTION AND SHARE BY ENERGY SOURCE1


2023

2022


Fuel consumption from coal and coal products (MWh)

0

0

Fuel consumption from crude oil and petroleum products (MWh)

114,515

125,083

Fuel consumption from natural gas (MWh)

16,912

20,810

Fuel consumption from other fossil sources (MWh)

403

312

Consumption of electricity, heat, industrial process heat, steam and cooling
from fossil sources (MWh)

48,785

57,453

Total fossil energy consumption (MWh)

180,614

204,908

Share of fossil sources in total energy consumption (%)

90

92

Consumption from nuclear sources (MWh)

1,295

1,250

Share of consumption from nuclear sources in total energy consumption

1

1

Fuel consumption from renewable sources2

0

0

Consumption of electricity, heat, steam and cooling from renewable sources (MWh)

17,349

15,765

Consumption of self-generated non-fuel renewable energy (MWh)

773

166

Total renewable energy consumption (MWh)

18,121

15,931

Share of renewable sources in total energy consumption (%)

9

7

Total energy consumption (MWh)

200,031

220,838


1 Based on direct and indirect energy consumption classified as relevant for Scope 1 and Scope 2 in accordance with the GHG Protocol.
2 Including biomass (also comprising industrial and municipal waste of biologic origin, biogas, hydrogen from renewable sources, etc.)

Emissions

Emissions Scope 1 and 2

The Bilfinger Group’s greenhouse gas emissions are reported in metric tons in CO2 equivalents (tCO2e) in accordance with the method specified in the Greenhouse Gas Protocol. CO2 equivalents are the unit of measurement for the uniform measurement of different greenhouse gases. In addition to the greenhouse gas carbon dioxide (CO2), the effects of the greenhouse gases methane (CH4) and nitrous oxide (N2O) are also included. GHG emissions in Scope 1 amounted to 32,594 (previous year: 35,643) tCO2e in the reporting year. For Scope 2, the data is reported in both calculation methods of the GHG Protocol. Emissions in Scope 2 location-based were 10,370 (previous year: 16,548) tCO2e in 2023 and 12,723 tCO2e when using the market-based calculation (previous year: 14,047 tCO2e).

Calculation

For the reporting, we established organizational boundaries in accordance with the Greenhouse Gas Protocol methodology. We have adopted the financial control approach. This means that reporting is based on the financial organization and considers all fully consolidated companies.

Direct greenhouse gas emissions originate from sources that are owned or financially controlled by the Bilfinger Group, i.e. relate to leases relevant to IFRS 16.

Scope 1 includes direct emissions from the burning of fuels for heating and cooling buildings, powering vehicles and machinery and volatilized gases that escape over time from refrigeration units. For Scope 1, this refers to:

  • Burning of natural gas, oil and other materials for heating the properties
  • Emissions of hydrofluorocarbons (HFCs) from the use of air-conditioning systems in the properties
  • Combustion of diesel, gasoline and liquefied petroleum gas (LPG) in owned or IFRS 16-compliant leased vehicles and machinery


Scope 2 includes emissions from the use of electricity, steam, heating and cooling purchased by the company from utilities (indirect emissions). This relates to:

  • Electricity consumption in properties, fleet and machinery
  • Purchased district heating, steam and cooling


Emissions are calculated using the following formula: Energy (kWh) x emission factor (kg CO2e/kWh) = emissions (kg CO2e)


We changed the database for emission factors for the financial year and now obtain them from the International Energy Agency (IEA) instead of database provider Ecoinvent. The reason for the switch is the clearer distinction between Scope 1 and Scope 2 to Scope 3 emissions, which are derived from the IEA data. It was determined that Ecoinvent has already partially processed Scope 3 effects in the emission factors. In both databases, the basis for the calculation is the methodology developed by the Intergovernmental Panel on Climate Change (IPCC) 2013-climate change-GWP 100a-(kg CO2-Eq) per 1 unit of reference product.

Scope 2 location-based emissions are calculated using the following formula:

Energy (kWh) x emission factor country average (kg CO2e/kWh) = location-based emissions (kg CO2e)

In the market-based method, the emission factor of contractually regulated instruments is taken into account; otherwise, the residual mix factor is used:

Energy (kWh) x contract-specific emission factor or residual mix factor (kg CO2e/kWh) = market-based emissions (kg CO2e)

In our business activities, we often work at client sites and also rent properties from site management companies. In this constellation, we often pay gross rents that include supplementary costs, which makes it difficult or impossible to obtain individual consumption statements. The contract-specific emission factors are, however, decisive for our reporting in the market-based variant. If proof of the factors is not available, the GHG Protocol requires use of the residual factor, which is often higher than the average factor used in the location-based calculation method.

Scope 1 emissions amounted to 32,594 tCO2e in the financial year (previous year: 35,643 tCO2e) and were therefore 9 percent lower than in the previous year. When calculated using the IEA emission factors on a comparable basis, the Scope 1 value for 2022 is 33,856 tCO2e. The reduction in Scope 1 without the influence of the emission factor conversion is therefore 4 percent.

Location-based emissions were 10,370 tCO2e in the financial year (previous year: 16,548 tCO2e). This corresponds to a reduction of 37 percent. On a comparable basis, the location-based Scope 2 value for 2022 is 10,385 tCO2e. This corresponds to a reduction of 0.1 percent. 

In the market-based calculation, Scope 2 emissions amounted to 12,723 (previous year: 14,047) tCO2e and were thus 9 percent below the previous year’s figure. On a comparable basis, the market-based Scope 2 value for 2022 is 15,034 tCO2e. This corresponds to a reduction of 15 percent.

Emissions Scope 3

The extent and quality of data collection for calculating emissions is a prerequisite for measuring the degree to which our climate-related targets have been achieved and for managing the corresponding levers in emission reduction initiatives. To gain a better understanding of emissions in our value chain, we have developed a concept for a step-by-step reporting approach. In 2022, the waste category was reported as the first Scope 3-relevant emission source in Bilfinger’s upstream value chain. In line with our concept, all other upstream categories were added in the 2023 financial year. Plans call for the downstream value chain categories to be added in 2024.

In the 2023 financial year, the spend-based calculation method is primarily used to determine emissions from the upstream Scope 3 categories. Data from accounting and financial systems are used for this purpose.

Calculation

Country-specific as well as industry-specific CO2 factors are necessary for the calculation of emissions. We make use of the CEDA (Comprehensive Environmental Data Archive) database for this purpose.

For entities that use accounting systems other than the company’s primary accounting system, emissions are calculated by extrapolation. The CEDA categories used in the primary accounting system are used to calculate an average emission factor. The different country allocations are taken into account.

Purchased goods and services

GHG emissions associated with the production and transportation process of purchased goods and services are calculated on the basis of spend in this category. It includes spend to external suppliers for the provision of goods and services purchased in the course of Bilfinger’s business activities. This includes portions of the cost of sales, for example in the form of cost of materials including expenditures for subcontractors, employee training or other external services, as well as expenses for current assets such as inventories in the form of protective clothing and tools or stockpiling for the use of materials at customer sites. The material and service categories are based on the same account logic used for accounting purposes.

Capital goods

The capital goods category comprises non-current assets that are capitalized in the balance sheet at the time they are available for use by the Group. In order to avoid double counting over the years and to be able to carry out the calculation without overlaps with the purchased goods and services category, the production and transportation emissions for these goods are included in the carbon footprint once in the year of acquisition.

Fuel and energy-related activities (not included in Scope 1 or Scope 2)

This category includes the indirect greenhouse gas emissions caused by the production and transportation processes of the energy and fuels used in Scope 1 and 2. Consumption recorded in Scope 1 and 2 is determined using additional CO2 conversion factors used for the calculation. The sources for these factors are the DEFRA database and the IEA database. The emissions reported in this category are the WTT (well-to-tank) emissions. For electricity and district heating, where transmission and distribution losses occur in the energy grids, the associated T&D (transmission and distribution) emissions are also added. The calculation is based on country-specific factors that take into account the energy mix and the infrastructure of the energy grids in each country. Not included are the WTT-T&D emissions, which are the emissions generated in the upstream chain of the lost energy quantities.

Upstream transportation and distribution

Emissions in the upstream transportation and distribution category represent the indirect greenhouse gas emissions generated by suppliers through the transportation and delivery of raw materials, materials and products to Bilfinger. Emissions caused by commissioned forwarding services are also added to this category. This also includes deliveries to customers commissioned by Bilfinger. The volume of emissions is determined on the basis of expenditure.

Waste generation in operations

This category includes indirect greenhouse gas emissions resulting from the treatment and disposal of waste generated during Bilfinger’s business activities. Following the calculation logic of the GHG Protocol, the waste type and quantity as well as the waste treatment method are required to determine the emissions from waste generated, because the emission factors vary accordingly. The data collection method is similar to the data collection for Scopes 1 and 2. The respective volumes and treatment methods from the operating areas are subjected to a software-based documentation. At locations where the disposal of non-hazardous waste is included in the rent and no billing is available, no values were recorded in the system.

The key figures on waste generation can be found here [LINK].

Business traveling

The business traveling category includes indirect greenhouse gas emissions caused by the mobility of employees in the course of their work activities. This includes business travel undertaken by employees using various means of transportation including air travel, rail travel and car travel as well as overnight stays in hotels. The calculation method is spend-based. This includes expenses to travel agencies, airlines, car-rental companies and hotels on the one hand, and reimbursements to employees as part of travel expense reports on the other.

Employee commuting

The employee commuting category includes indirect greenhouse gas emissions caused by regular commuting from the employees’ place of residence to their primary place of work. The average data method is used for the calculation. The average values are based on benchmark studies. The average emission values for this Scope 3 category in the service sector were determined by an external consulting firm on the basis of the data reported as part of the 2021 CDP rating. The factor calculated in this way is 2.78 tCO2e per full-time equivalent (FTE). It is used for current reporting and multiplied by the number of employees, measured in FTE, at Bilfinger excluding the Other Operations segment.

Upstream leased assets

Indirect emissions from the use of rented or short-term leased buildings, machinery or vehicles that are not owned by Bilfinger are reported in the upstream leased assets category. Because the emissions from use of all IFRS 16-compliant leased assets are already included in Scope 1 and 2, this category is based on the spend-based calculations for short-term and low-value leases.

Sustainability is at the heart of our corporate strategy. As an industrial services provider, we want to ensure that our customers receive the best possible level of support when it comes to achieving their sustainability goals. Our portfolio of services offers solutions for reducing emissions and increasing plant efficiency. In addition to increasing efficiency for our customers, sustainability and the sensible use of resources are also extremely important for Bilfinger itself."

Dr. Nicola GesingSenior Manager Sustainability at Bilfinger
Emissionen nach GHG Protocol gesamt

Total emissions in accordance with GHG Protocol

An overview of the total emissions by Scope is shown in the following table.

Detailed overview Scope 1,2 & 3

CO2 EMISSIONS IN ACCORDANCE WITH THE GHG PROTOCOL1


2023

2022


CO2e emissions Scope 1 (tCO2e)2

32,594

35,643

CO2e emissions Scope 2 location-based (tCO2e)2

10,370

16,548

CO2e emissions Scope 2 market-based (tCO2e)2

12,723

14,047

Total CO2e emissions Scope 1 and Scope 2 location-based (tCO2e)

42,964

52,191

Total CO2e emissions Scope 1 and Scope 2 market-based (tCO2e)

45,317

49,690

CO2e emissions Scope 3 upstream (tCO2e)2

795,085

n/a

Purchased goods and services (tCO2e)

631,641

n/a

Capital goods (tCO2e)

28,682

n/a

Fuel and energy-related activities (not included in Scope 1 or Scope 2) (tCO2e)

12,554

n/a

Upstream transportation and distribution (tCO2e)

8,682

n/a

Waste generated in operations (tCO2e)

660

675

Business traveling (tCO2e)

17,994

n/a

Employee commuting (tCO2e)

75,488

n/a

Upstream leased assets (tCO2e) (excluding IFRS-16 relevant contracts)

19,384

n/a


The calculation method is based on the GHG Protocol using the financial control approach. Scopes 1, 2 and 3 include direct and indirect emissions from all fully consolidated companies. Companies that are in the process of being sold are excluded. This applies to the complete reporting segment Other Operations.

The emission factors used are from the International Energy Agency (IEA). Emission factors published by the UK Department for Environment, Food & Rural Affairs (DEFRA) were also used. Data from the Association of Issuing Bodies (AIB) were used to determine the residual mix for the market-based calculation. The CO2 conversion factors for the spend-based calculations come from the Comprehensive Environmental Data Archive (CEDA) database

We also present intensity indicators for both our direct and indirect emissions in order to make the development transparent irrespective of the company’s growth. The CO2 equivalents from Scope 1 and Scope 2 are set in relation to energy consumption, Group revenue and the number of employees. We also report the intensity indicators for Scope 3 emissions in the upstream value chain in relation to revenue and the number of employees. When calculating intensity, the number of employees is measured as full-time equivalents (FTE).

Detailied overview intensity indicators

CO2 EMISSIONS IN ACCORDANCE WITH THE GHG PROTOCOL –
INTENSITY INDICATORS1


2023

2022


CO2e intensity Scope 1 and 2 (location-based) in relation to total energy consumption (tCO2e / MWh)

0.21

0.24

CO2e intensity Scope 1 and 2 (location-based) in relation to revenue (tCO2e / € million)

9.95

12.68

CO2e intensity Scope 1 and 2 (location-based) in relation to the number of employees (tCO2e / FTEs)

1.58

1.77

CO2e intensity Scope 1 and 2 (market-based) in relation to total energy consumption (tCO2e / MWh)

0.23

0.23

CO2e intensity Scope 1 and 2 (market-based) in relation to revenue (tCO2e / € million)

10.49

12.08

CO2e intensity Scope 1 and 2 (market-based) in relation to the number of employees (tCO2e / FTEs)

1.67

1.68

CO2e intensity Scope 3 (upstream) in relation to revenue (tCO2e / € million)

184

n.a.

CO2e intensity Scope 3 (upstream) in relation to the number of employees (tCO2e / FTEs)

29.28

n.a.


Energy consumption, revenue, and FTEs do not include the Other Operations reporting segment.

Reduction of GHG emissions and Science Based Targets Initiative

In April 2023, we made clear our intention to set ambitious, science-based targets by registering with the Science Based Targets Initiative (SBTi). We have set the goal of reducing our GHG emissions by the end of the 2050 financial year and are targeting the SBTi-compliant reduction pathway for GHG emissions to limit global warming to a maximum of 1.5 degrees Celsius. There are no industry-specific requirements for Bilfinger’s business activities at SBTi. The average target horizons therefore apply.

We have already defined a compliant target for our Scope 1 and Scope 2 emissions. Our goal is to reduce GHG emissions in Scopes 1 and 2 by 50 percent by the end of the 2030 financial year compared to the base year 2021. This reduction does not include carbon credits or the purchase of climate certificates.

Learn more

To ensure the uniform assessment and management of the implementation of the segment-specific concepts, we have established an internal process that can be used to record and assess our reduction measures, including their impact on operating cost structures and investment requirements. This process will be rolled out throughout the Group in all segments in 2024 and is an important basis for achieving our GHG reduction targets.

Our goal is to submit our targets to the SBTi for review by April 2025 at the latest. Before this is possible, the emissions of the entire value chain must be determined. Indirect emissions from the upstream value chain were determined in the reporting year.

Industrial services to enhance efficiency and sustainability

Industrial services to enhance efficiency and sustainability  

For Bilfinger as a service provider, customers are the focus of business activities. The relationship with our customers and their satisfaction with the work that we do are of utmost importance for our business development. We are integrated into their value chain as a strategic partner. Our target is to be the leading partner for our customers when it comes to enhancing the efficiency and sustainability of their plants. This vision forms the basis of our business model and is at the core of our Group’s strategic direction.

With our portfolio of services, we are addressing the imminent decarbonization of energy-intensive production, transport and processing operations and increasing energy efficiency at all stages of the customer value chain. Low-carbon energy generation and the reduction of energy consumption and emissions are key here.

Our concept

Increasing awareness of climate change and the ensuing energy transition in many industrialized countries are opening up attractive market opportunities in Europe, North America and the Middle East for Bilfinger as a leading industrial services provider. This is all the more true given that a major share of our customers are active in energy-intensive industries. The energy, chemical & petrochemical, pharma & biopharma and oil & gas industries are the Bilfinger Group’s largest customer groups. Given the measures required for the energy transition and climate protection, some of these industries are currently undergoing fundamental innovation processes in all key stages of the value chain. Our customers have the immediate task of enhancing their plants, securing their future energy supply and significantly reducing their carbon footprint in the process.

Our Group portfolio brings together services that contribute to increased efficiency and sustainability in various customer segments. They deviate from the specifications of environmentally sustainable activities as defined by Regulation(EU) 2020/852 EU Taxonomy Regulation, which is explained elsewhere.

A detailed analysis of customer contracts by plant type and trade forms the basis for determining the revenue from increasing the efficiency and sustainability of our customers.

Overall, revenue in categories A and B increased in the reporting year to €739.1 million (previous year: €713.0 million). The share of these activities in total Group revenue is expected to increase further in the future.


Explanations for categories A - D

We believe that revenue from our customers’ investments in plants directly related to the energy transition and our ongoing activities in these plants make the greatest contribution to the energy transition and are therefore assigned to category A. This takes into account the majority of the trades that are carried out as part of the respective order. Revenue in category A increased to a total of €478.0 million (previous year: €445.4 million).

Category B includes activities for the maintenance and modernization of plants not included in A with the objective of more energy-efficient plant use with the same or higher capacity utilization. These generated revenue of €261.1 million in 2023 (previous year: €267.6 million). The largest share in this context is accounted for by optimizing the temperature insulation of industrial plants.

Overall, revenue in categories A and B increased in the reporting year to €739.1 million (previous year: €713.0 million). The share of these activities in total Group revenue is expected to increase further in the future.

In addition, Bilfinger provides extensive services in category C to support the activities in categories A and B. These include, for example, services in industrial scaffolding, which serve as a prerequisite for the installation of insulation in plant types that do not fall under category A. Engineering, maintenance or the installation of electrical, instrumentation and control technology (E, I&C) to increase the efficiency of plants outside category A are also taken into account here. Revenue in category C amounted to €3,386.8 million in the reporting year.

In addition, activities in coal-fired power plants and oil-fired power plants are assigned to category D. There is also revenue from employee leasing that was not included in category A. These activities generated revenue totaling €359.7 million in the reporting year. This category was surveyed in this detail for the first time in the reporting year, so there is no figure for the previous year.

The process industry is facing a transformation if it hopes to achieve corporate and sustainability goals. Plants and processes must become more efficient and sustainable. As a solutions partner, Bilfinger stands by its customers with an extensive portfolio and many years of expertise. "

Gerald Pilotto Chief Products & Innovation Officer at Bilfinger

With our many years of experience in the automotive sector and our broad expertise in the chemical industry, we can support our customers in a variety of ways and help them make their contribution to climate-friendly mobility throughout the entire battery value chain - from the production of raw materials and chemical components through to the gigafactory and also including final assembly and recycling."

Magda ZemanováAutomotive & Battery Market Leader for Central & Eastern Europe at Bilfinger in Czech Republic

A lot of people are not aware of the fact that air-conditioning systems also generate heat. In urban areas in particular, this leads to additional heating of the already overheated city cores in the summer. This effect can be significantly reduced if district cooling is provided through the bundled generation of cooling water outside the city!"

Markus GrubmairIndustrial and power plant piping construction at Bilfinger in Austria

Thanks to the outstanding level of flexibility and reliability that Bilfinger offers in its services, we are in a position to provide our customers with the best possible support in the area of hydropower. This is also reflected in the large number of long-standing customer relationships that we have."

Stephan EbnerGeschäftsbereichsleiter Hydro at Bilfinger in Austria

Compared to Carbon Capture Storage (CCS), the increased use of Carbon Capture Utilization (CCU) technologies can save valuable raw materials and reduce carbon emissions, creating an economically viable business case for significant reductions in greenhouse gas emissions."

Massimo PardocchiGlobal Development Director Projects & Key Account Management at Bilfinger

Consolidated disclosures pursuant to Article 8 of the EU Taxonomy Regulation

The EU Taxonomy Regulation is a key component of the European Commission’s action plan to direct capital flows to sustainable economic activities. It represents an important step toward achieving climate neutrality for Europe by 2050. In this context, the EU Taxonomy serves as a classification system for environmentally sustainable economic activities.

For more information on the EU Taxonomy Regulation, click here.

Learn more
captcha
Your message for
captcha